Research Poster
Concisely tell the story of your research with visual language.
In many academic fields posters are a popular way to present research findings. Researchers summarize their work concisely and attractively as a way to publicize their findings and generate discussion. Poster content can include text, tables, graphs, illustrations, and photos. Many professional conferences include sessions where participants can view several posters and interact with researchers. In this project you will gather and format your research into a standard research poster format, sharing your poster online.
Powerpoint Excel- Research
- Data
- Poster
Learning Goals
After you finish this activity you will be able to:
- Explain a single research project to an audience of professionals
- Simplify findings through the use of charts, tables, and other data visualization techniques
- Appropriately balance the use of image and text
Project Prerequisite
This project assumes you have already completed an academic research paper.
Follow these steps to complete the project.
To track your progress, click each step as you finish.
An excellent first step in creating any media work is to examine exemplary works of the same type. Make a list for yourself of what makes these examples strong and inspiring.
Don't skip this step!
| 1 | Peruse any or all of the links in the Get Inspired box. |
By growing your skills in the tools used in any project, you save yourself time and produce stronger work.
| 2 | Watch this tutorial on Making a Better Research Poster. |
| 3 | Peruse any or all of the other tutorials in the Tame Your Tools box. |
When beginning a new media project, it's best to organize your resources in a single location.
| 4 | Create a folder on your Desktop named something memorable, such as my-media-project. In this folder you'll organize all your resources for this project. |
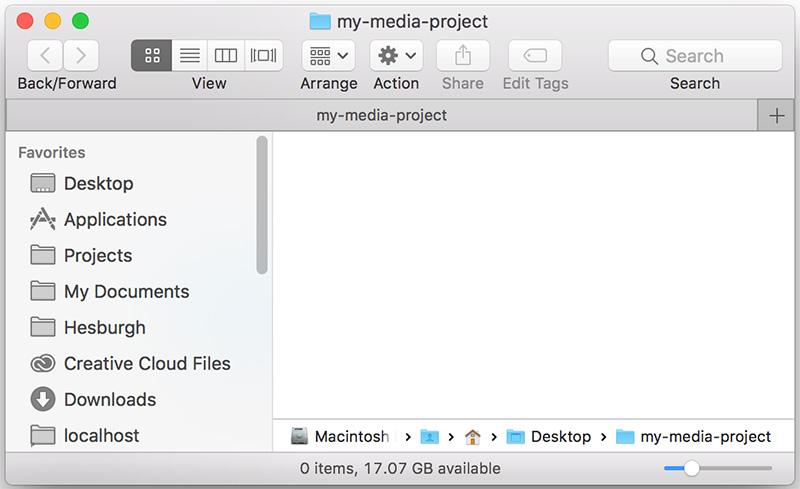
Alternate File Storage
You may also organize your documents in cloud storage, such as Box or Google Drive.
Research posters translate long and complex research into a single 48" x 36" poster which is highly visual—characterized by images, charts and graphs, bullet points, and no more than ~1000 words.
×Rule of thumb
As a rule of thumb ... the less words, the better. Be concise! You
will need to be very selective in what you include from your paper on your poster.
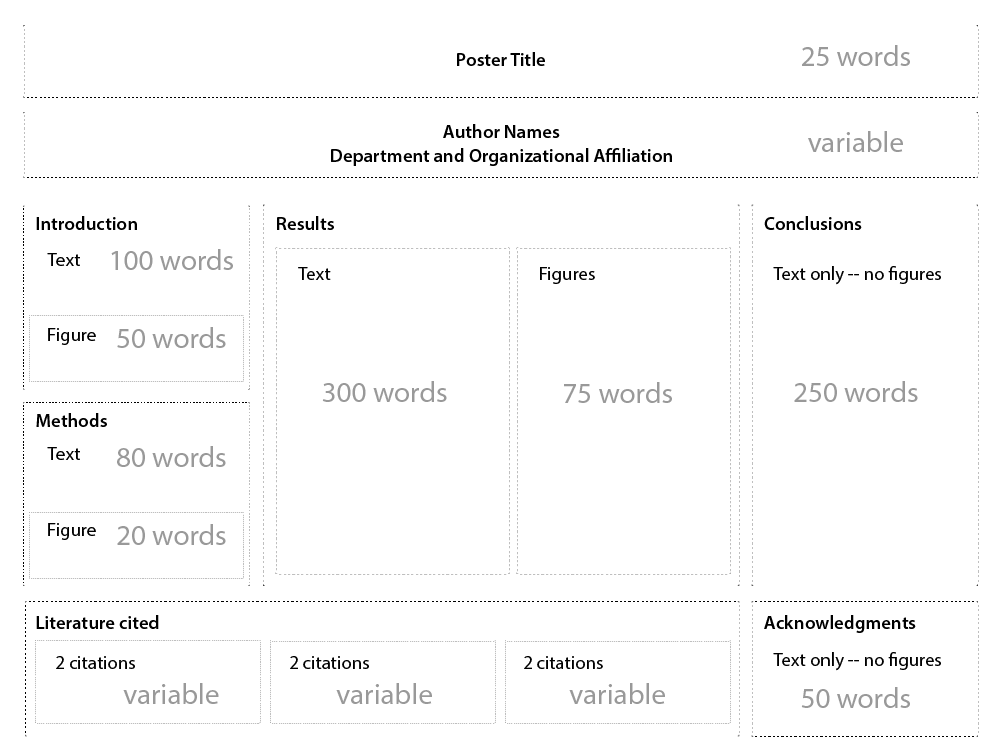
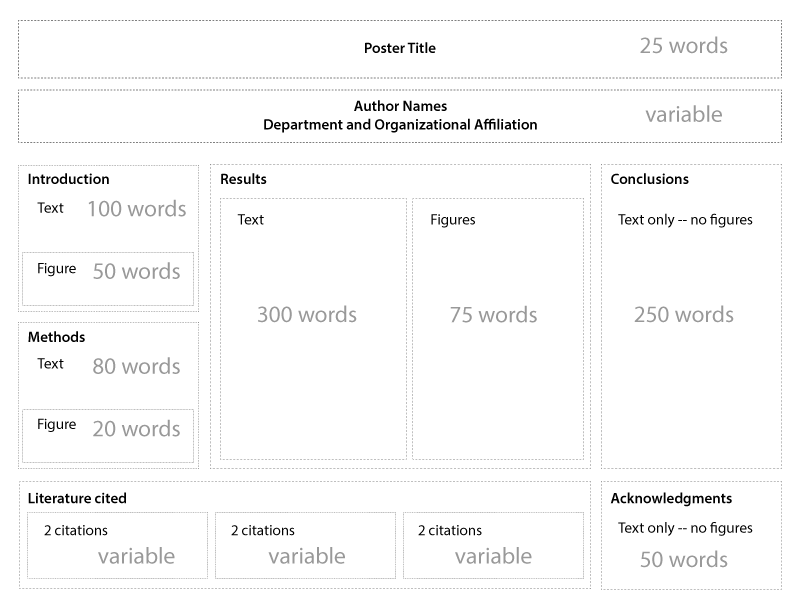
| 5 | First, visualize the layout of your poster as a collection of zones with word count limits. Many layouts are possible and word counts are approximations, but this format is fairly ubiquitous. |
| 6 | Next, with your research paper/project in hand, open the Research Poster Planning Inventory, copy it to your own Google drive and fill it out. |
| 7 | Make sure to save the Planning Inventory to your project folder when finished. |
In the next steps, you'll use the writing you did in the Poster Planning Inventory to structure your poster using Microsoft Powerpoint.
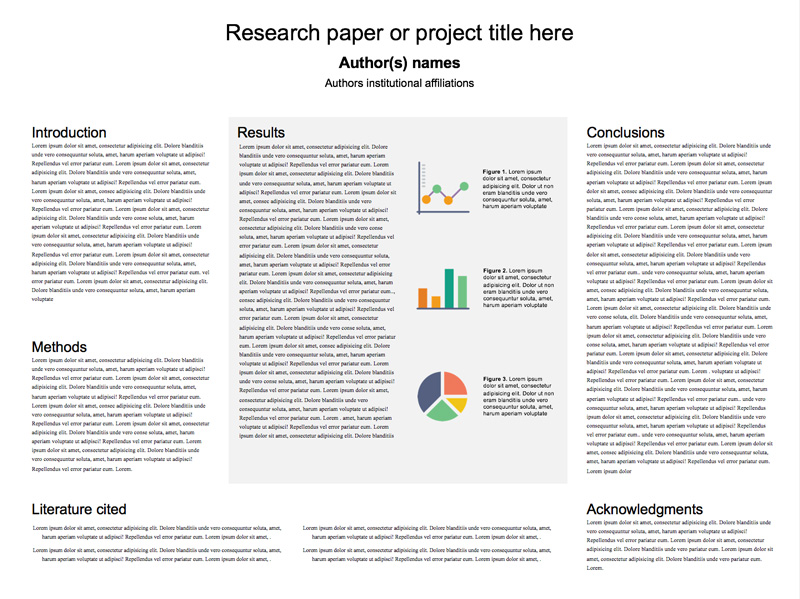
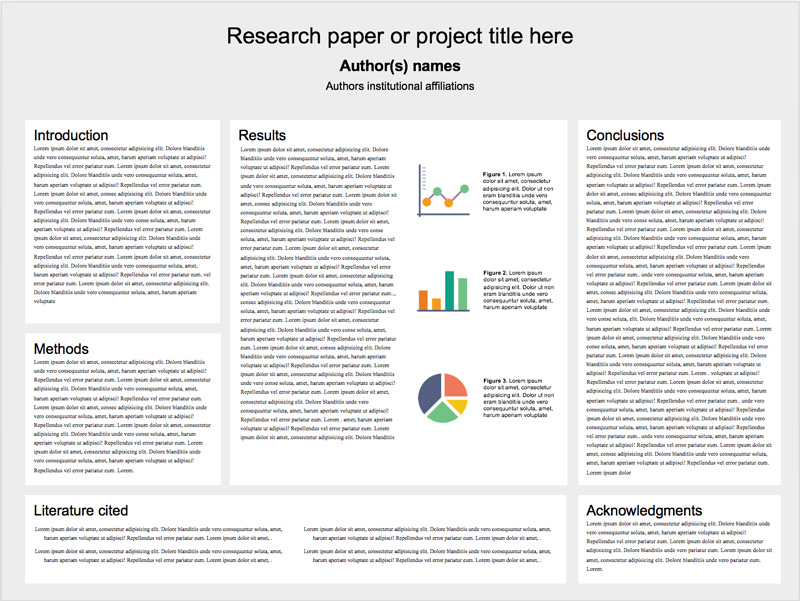
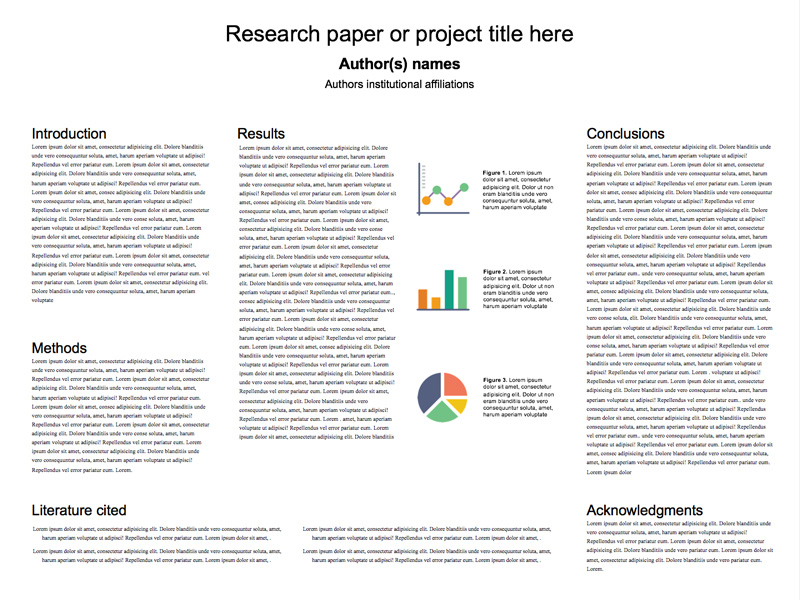
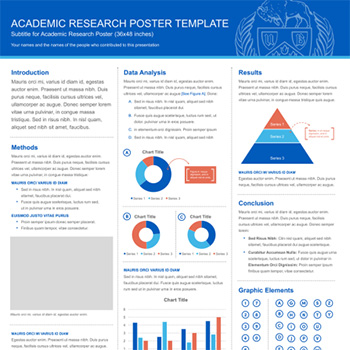
| 8 | First, download our Research Poster Template. You'll place your text, figures and images into the template to produce the poster. While the template is rudimentary, there are many ways to highlight certain features: |
| 9 | Make sure to save the presentation template you downloaded (example-presentation-light.pptx) to your project folder. |
Now, you'll modify the template with text from your Research Planning Inventory. Before we begin to modify your poster, you may wish to review Colin Purrington's research poster best practices, if you hadn't alredy.
| 10 | Next, replace the "Lorem Ipsum" (faux Latin placeholder text) with your own text, in the following sections:
|
Don't bother adjusting box and text size just yet. You'll add any images and charts in the next steps and make final adjustments to all the element once all content has been added.
Images are a powerful draw for your audience, as long as they don't overpower the poster. In this step you'll add any images you require.
| 11 | Select the tab. Then select to browse to your image. |
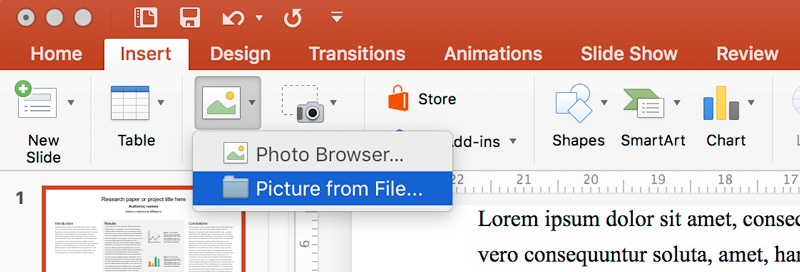
| 12 | Click the button to insert the image into the poster. |
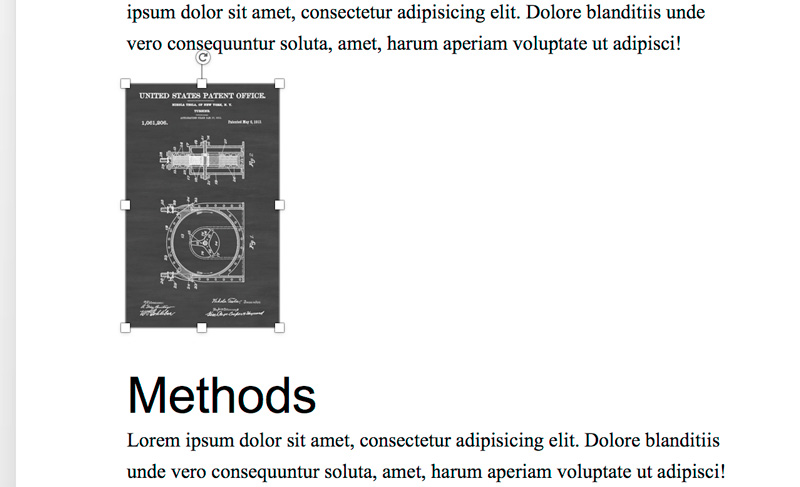
| 13 | Click into the center of the inserted image to expose the sizing handles. Click a corner of your image and drag to resize it. The circular icon atop the image will rotate it. |
| 14 | Next, under the tab, select the icon from the menu. |
| 15 | Click and drag out a rectangular text box next to the inserted image. Make sure to:
|
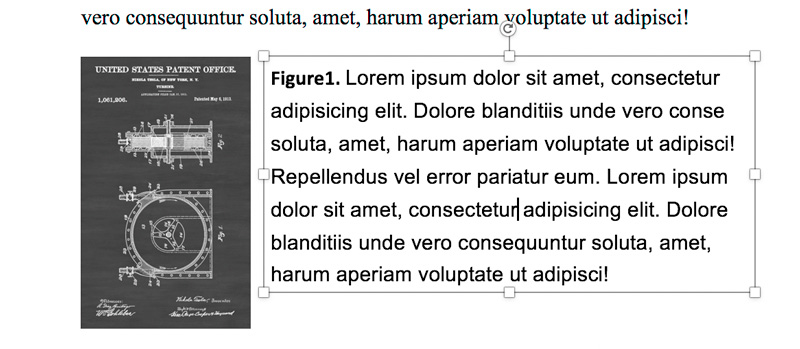
| 16 | Repeat steps 11-15 to add any additional images you require to the poster. |
Powerpoint allows you to embed a chart or graph which is linked to an Excel spreadsheet. This way, you may easily update the chart in your poster by updating the data in your spreadsheet.
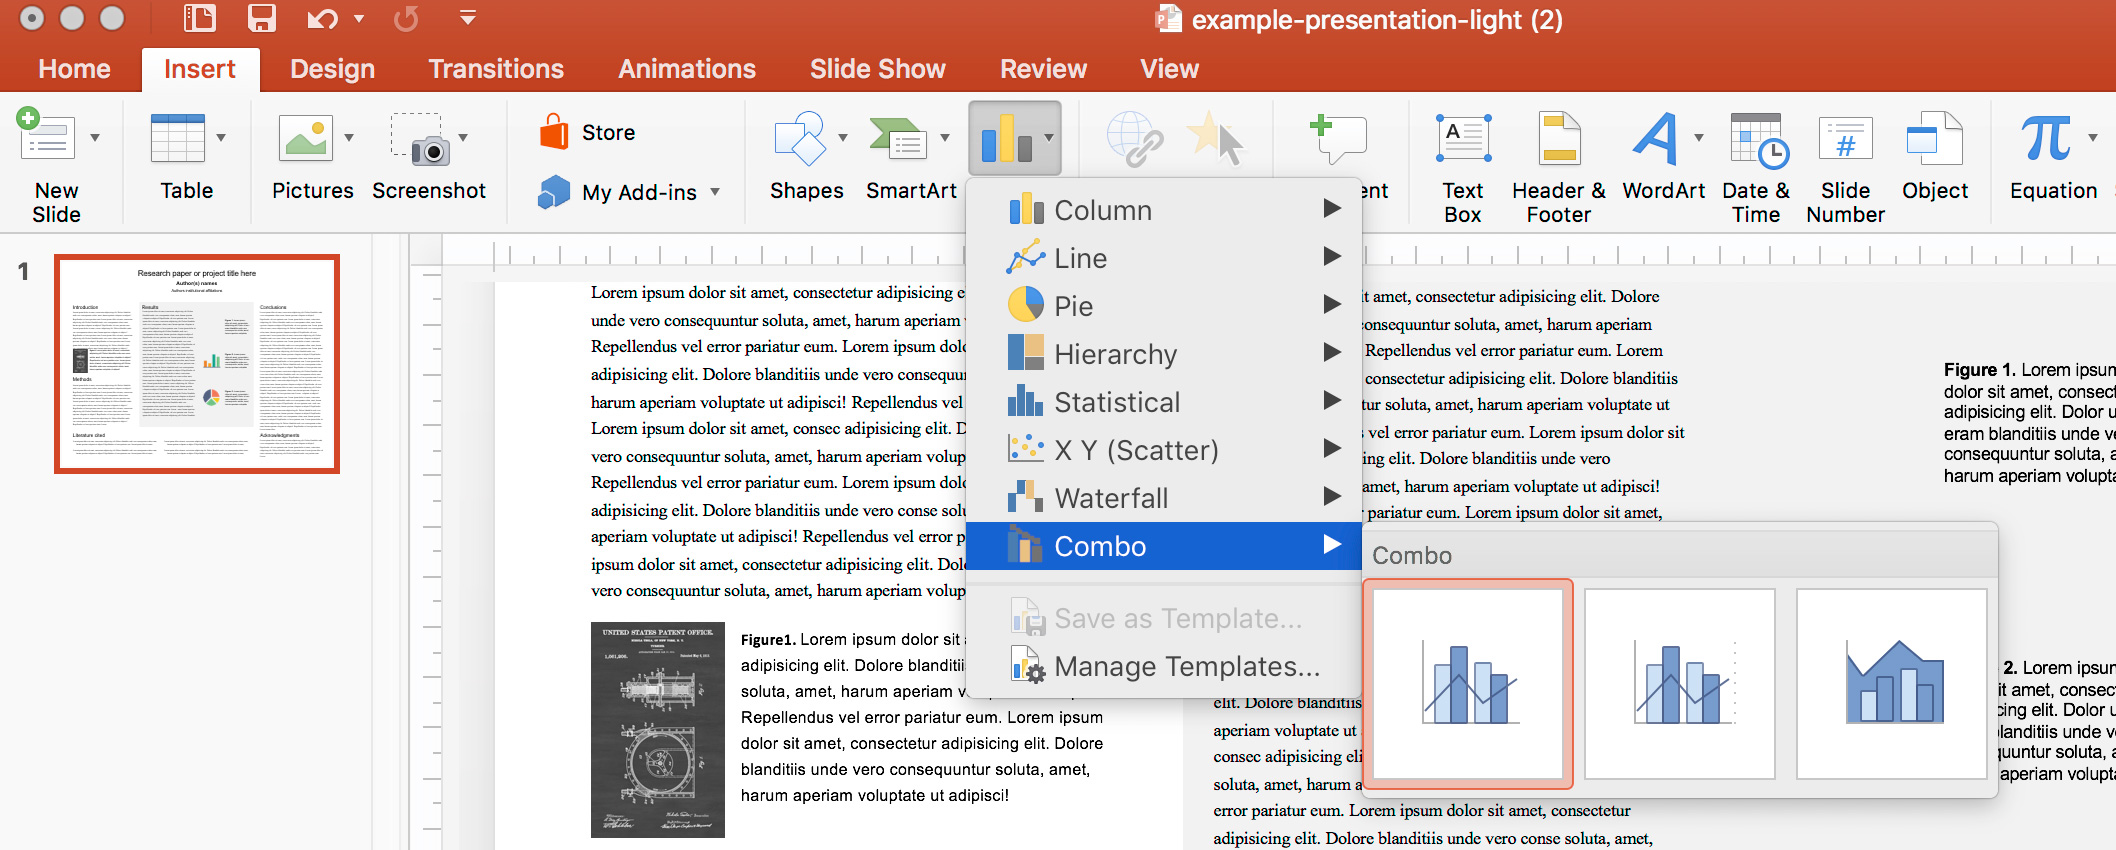
| 17 | Under the tab click the dropdown. Select the flyout to select the specific chart you wish. Click its icon to insert it. |
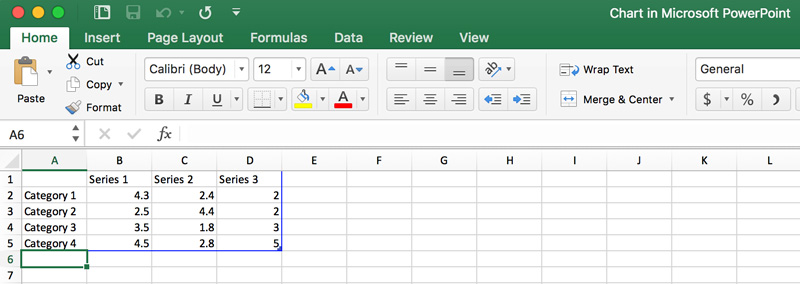
| 18 | Excel will now automatically open the associated spreadsheet for you to adjust the data and category names. Make sure to save this spreadsheet to your project folder. |
| 19 | Back in Powerpoint, select the inserted chart and resize it to fit your needs. Finally, double-click the Chart Title to edit it. |

Pro Tip
Make sure to hold down the Shift key while dragging the chart to maintain image proportions.
Depending on the size, printing a research poster can cost upwards of $40 dollars. For this reason, it's important to proof your poster carefully before submitting it for print.
| 20 | Proof your poster:
|
| 21 | Make sure that your page size is 48" (width) x 36" (height), and export your poster to a PDF or a .png file. |
| 22 |
Submit your poster for printing to one of the many service points on campus:
|
You may also wish to view your printing options at-a-glance.
Congratulations!
You've grown your multimedia literacy while creating cool things! Well done, you!
You might consider nominating work you are proud of to the Remix Project Showcase!
Example
Get Inspired
Explore examples of similar projects.
Tame Your Tools
Master the skills used in this project.
Get Help
Notre Dame has many helpful resources, including our Media Corps coaching staff, located in the Hesburgh Library.
Give Feedback
Remix is continually evolving. Please help us improve by providing feedback on this project or any other feature of Remix.
