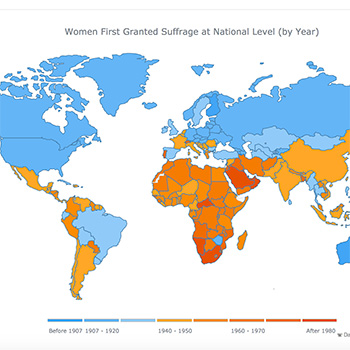
Choropleth Map
Use data visualization to make meaning dynamically.
Humans are innately designed to quickly understand and process visual information. Communication design can leverage this ability to enlighten and persuade an audience. Geographic visualizations help us understand weather conditions, population density, disease spread, language usage, migration routes, land usage, political activity, socio economic status, product purchases, conflict zones, internet connectivity, and much more. For this project you will display data using a choropleth map, one of many kinds of geographic visualization, in which numeric data are plotted onto regions, like countries or zip codes, and share your map online.
Tableau Excel- Data
- Visualization
- Map
Learning Goals
After you finish this activity you will be able to:
- Create an interactive choropleth map that is uncluttered and easy to understand
- Represent data accurately, without distortion
- Use data to tell a story that provides interesting insights
- Share your map online
Follow these steps to complete the project.
To track your progress, click each step as you finish.
An excellent first step in creating any media work is to examine exemplary works of the same type. Make a list for yourself of what makes these examples strong and inspiring.
Don't skip this step!
| 1 | Get inspired by visiting the links in the Get Inspired box. |
| 2 | Read or watch George Ella Lyon's ‘Where I'm From’ poem. |
By growing your skills in the tools used in any project, you save yourself time and produce stronger work.
| 3 | Peruse any or all of the tutorials in the Tame Your Tools box. |
When beginning a new media project, it's best to organize your resources in a single location.
| 4 | Create a folder on your Desktop named something memorable, such as my-media-project. In this folder you'll organize all your resources for this project. |
Alternate File Storage
You may also organize your documents in cloud storage, such as Box or Google Drive.
Congratulations!
You've grown your multimedia literacy while creating cool things! Well done, you!
You might consider nominating work you are proud of to the Remix Project Showcase!

Example
Get Inspired
Explore examples of similar projects.
Tame Your Tools
Master the skills used in this project.
Get Help
Notre Dame has many helpful resources, including our Media Corps coaching staff, located in the Hesburgh Library.
Give Feedback
Remix is continually evolving. Please help us improve by providing feedback on this project or any other feature of Remix.